Author: nespE4

Michigan Shares Thoughts on NSPM and OpenBCA Tool

Michigan Shares Thoughts on NSPM and OpenBCA Tool

Q&A with Luke Dennin, MI Public Service Commission Fellow

(Continued from NESP News, June 2025)

Phase I Recap

To support the development of the OpenBCA Tool, the project team convened four Michigan-stakeholder events: two stakeholder meetings and two technical subgroup sessions. These engagements were designed to build foundational understanding, gather input, and begin shaping the model’s core structure.

The project kicked off with an overview of the Commission Order that initiated the OpenBCA Tool, outlining the tool’s purpose, project phases, and the importance of stakeholder input. (See a summary table describing the tool’s range of applications.) Subsequent technical subgroup sessions focused on the model’s core structure – data types, equations, and methodologies – while intentionally avoiding specific inputs at this stage. In the second stakeholder meeting, the team clarified the tool’s intended use, shared a project update, and introduced the BCA Impacts Methodology matrix, walking through examples to illustrate how each impact is broken down into equations and variables. 

Thanks to the thoughtful input from Commission Staff and the BCA Tool Collaborative, the project is now moving into Phase II, to fully develop the analytical backend that offers methodological options for calculating both utility and non-utility system impacts, including methods for use by Michigan. Following Phase II, the team will shift its attention to building the user interface and integration layer, drawing on further stakeholder feedback to guide design decisions.

Q&A with Luke Dennin, U.S. DOE Fellow, MI PSC

NESP invited MI PSC to answer four questions about its engagement in the development of the OpenBCA Tool, and its vision for how it, along with other analyses, can support the Commission’s decision-making in utility investments in DERs, and potentially other resources. Many thanks to Luke for sharing these thoughtful responses!

Q1: How does Michigan expect to use the OpenBCA Tool? 

Michigan envisions using the OpenBCA Tool as both a practical resource and a significant step forward in the application of BCA to utility system decision-making. The state is increasingly turning to BCA to understand which utility investments are cost-effective and deliver the greatest overall value to the electric system and its customers. However, in many cases, BCA modeling remains largely opaque. Analyses are often conducted using proprietary tools or by third-party contractors, making it difficult for interested parties to scrutinize key assumptions, input data, and the treatment of different value streams.

The OpenBCA Tool offers a meaningful shift. As an open-access and user-friendly model, it is poised to foster more transparent and inclusive assessments and conversations about the benefits and costs of DER projects. While some technical barriers will remain due to the tool’s necessary rigor and complexity, open-access modeling enables peer review, sensitivity testing, and a better understanding of how results respond to different assumptions or preferences. This enhanced transparency supports more democratic, data-driven decision-making in a utility system that is growing more complex with each new DER technology.

From a procedural standpoint, the OpenBCA Tool is already positioned to play a central role in Michigan’s regulatory processes. In Case U-20898, the MPSC ordered that BCA for DER pilot projects must adhere to a defined set of principles and specifications, informed by an extensive interested party process and guided by the NSPM[1]. While the order does not mandate the use of a specific tool, the Commission launched a collaborative to develop a spreadsheet-based or similar open-source tool to serve as the standard platform for these analyses. Staff expects the OpenBCA Tool to be uniquely capable of meeting these standards with the level of rigor, clarity, and flexibility they require. As a result, the tool is expected to be used in utility DER pilot programs at a minimum, with potential for broader application in the future. Although the full scope of future adoption is uncertain, the OpenBCA Tool could emerge as a common platform for DER-related BCA, supporting utilities, regulators, and other interested parties in making more informed and transparent decisions within an increasingly dynamic energy landscape.

Q2: What lessons might other states take from Michigan’s progress?

One of the most important lessons from Michigan’s experience is the value of doing the qualitative groundwork early—specifically, by engaging with the principles and guidelines laid out in the NSPM and working through key subjective decisions in advance. Michigan undertook a rigorous, multi-year process to understand the foundational concepts in BCA for DERs and to make clear, deliberate choices about how those concepts should be applied for the state[2]. Establishing these standards upfront—before diving into the technical modeling—helped ensure a shared understanding of how the technical details contribute to the higher-level goals.

A strong example is the definition of a Jurisdiction-Specific Test (JST). The NSPM emphasizes that each jurisdiction should define its own primary test based on its unique policy goals. In Michigan’s case, this led to the adoption of a Societal Cost Test (SCT) as the JST. This approach reflects a recognition that DERs have impacts not only on the utility system but also on host customers and broader society—including environmental, public health, and reliability- and resilience-related benefits. Other jurisdictions may arrive at different conclusions. For instance, a state primarily focused on ratepayer impacts might adopt a Utility Cost Test (UCT), as the value streams in this category are limited to the utility system and are the drivers of customer rates. Both choices are valid; the key is defining the JST to be grounded in state-level priorities and policies and ensuring transparency for all interested parties.

Michigan’s approach also highlights the importance of resolving other subjective modeling decisions early as well. For example, Michigan Staff supported the use of a lower, social discount rate to better reflect long-term societal impacts, while utilities advocated for a higher rate aligned with the weighted average cost of capital. Addressing these differing perspectives within a formal regulatory proceeding has been crucial to establishing clarity and managing expectations before modeling begins.

Another important lesson is recognizing both the strengths and limitations of BCA. While Michigan is increasingly using BCA to inform DER and other utility investment decisions, there is broad understanding that a project being cost-effective is not, on its own, a sufficient reason to proceed. Cost-effectiveness is just one component of a broader decision-making framework—alongside considerations such as rate impacts and distributional effects. Ensuring that electricity remains affordable and that the benefits and costs of DERs are fairly distributed across all customers remains a key priority.

Finally, Michigan’s experience demonstrates the importance of continuity and historical awareness. Again, the state’s BCA for DERs effort has been a multi-year process. For interested parties, staying informed about the work conducted in the past, the challenges faced in the present, and the emerging questions of the future has been essential for meaningful and sustained participation. The process is complex and evolving, but long-term engagement—along with a willingness to ask questions and learn—has been critical to the process.

Q3: What value has the collaborative process added so far?

Collaborative processes have been essential to Michigan’s progress in developing a BCA framework for DERs. From the outset, interested party engagement has been a core design principle—not an afterthought. This commitment began with the launch of the MI Power Grid initiative in 2019, which aimed to maximize the benefits of DERs[3]. In 2020, the Commission formed the New Technologies and Business Models workgroup[4], which issued a 2021 staff report recommending the development of a Michigan-specific BCA framework grounded in the NSPM[5]. Interested parties were actively involved from these earliest stages.

Collaboration deepened in 2023 when DTE Electric Company and Consumers Energy Company, working with the Michigan Electric and Gas Association (MEGA) and the Association of Businesses Advocating Tariff Equity (ABATE), submitted a proposed BCA framework[6]. Their proposal included the use of a JST defined from a societal perspective, standardized methods for assessing value streams, and guidance on evaluating pilot programs “at scale.” Interested parties—including Commission Staff and advocates—were then asked to provide feedback on the proposal, which ultimately led to subsequent decisions by the Commission on numerous key design elements[7].

This broad engagement added significant value by bringing multiple perspectives to bear on critical questions: which value streams to include, what must be monetized or otherwise quantified, and whether a standardized, spreadsheet-based BCA tool is necessary. By considering these diverse viewpoints, the Commission was able to reconcile differences and define the path forward—calling for broad inclusion of impacts, monetization where feasible, and the development of an open-access, user-friendly tool[8].

That same spirit of collaboration is now informing the BCA tool’s development[9]. E4TheFuture, ICF, Recurve, and LBNL are leading technical work, but their efforts are guided directly by input from Michigan’s interested parties—including Commission Staff, utilities, and advocates. Those engaged since the beginning of these efforts continue to have a voice, helping ensure that the tool reflects shared priorities. This inclusive process prevents the tool from becoming a “black box” or a one-sided product, instead fostering transparency, trust, and buy-in for its eventual use.

In short, collaboration has laid the foundation for a robust, inclusive, and policy-aligned BCA framework for DERs in Michigan. It is this foundation that makes the work sustainable, defensible, and ultimately implementable.

Q4: How does this work align with broader regulatory or DER trends in the state?

This work aligns closely with Michigan’s broader regulatory direction. Foundationally, the Commission’s mission is to serve the public by ensuring safe, reliable, and accessible energy (and telecommunications) services at reasonable rates[10]. This mission is especially critical now, as the state faces evolving challenges and opportunities in the energy sector. With many potential paths forward, a central question remains: which projects and programs will be most effective and impactful?

BCA provides a crucial framework to help answer that question. By evaluating alternatives in common, comparable terms, BCA enables more objective, data-driven decision-making. In a context where every dollar spent should be justified—effectively at a minimum, and optimally whenever possible—rigorous and transparent BCA tools are essential. They support decisions that can withstand scrutiny, build public confidence, and ultimately lead to better outcomes for customers across the state.

Regarding DERs, Michigan recognizes these technologies will play a major role in the future grid. DERs offer the potential to alleviate system stress, reduce emissions, improve resilience, and enable more affordable electricity. However, realizing those benefits depends on thoughtful, cost-effective deployment. This requires moving beyond enthusiasm for DERs as a concept to deliberate, strategic investment where benefits are greatest.

Energy planning always involves uncertainty—especially when investments require large upfront costs and have long-term payback horizons—but using robust BCA tools enables the state to make better-informed decisions with a higher likelihood of success. The development of Michigan’s BCA framework and the OpenBCA Tool is laying the foundation for a future where DER investments are not just numerous but meaningful—designed to deliver real, measurable value for all interested parties.

Acknowledgments: I would like to thank Tayler Becker and Carmen Wagner at the MPSC for their valuable comments.


[1] Michigan Public Service Commission. “Filing U-20898-0040.” MPSC Case No. U-20898. October 12, 2023.

[2] Michigan Public Service Commission. “Filing U-20898-0040.” MPSC Case No. U-20898. October 12, 2023.

[3] Michigan Public Service Commission. “Filing U-20645-0001.” MPSC Case No. U-20645. October 17, 2019.

[4] Michigan Public Service Commission. “Filing U-20898-0001.” MPSC Case No. U-20898. October 29, 2020.

[5] Michigan Public Service Commission Staff. “Filing U-20898-0004 – New Technologies, Business Models, and Staff Recommendations.” MPSC Case No. U-20898. January 12, 2022.

[6] DTE Electric Company & Consumers Energy Company. “Filing U-20898-0022 – Proposed Requirements and Further Guidance on Benefit-Cost Analysis for Pilot Initiatives.” MPSC Case No. U-20898. February 1, 2023.

[7] Michigan Public Service Commission. “Filing U-20898-0040.” MPSC Case No. U-20898. October 12, 2023.

[8] Michigan Public Service Commission. “Filing U-20898-0040.” MPSC Case No. U-20898. October 12, 2023.

[9]  Michigan Public Service Commission. “Filing U-20898-0044.” MPSC Case No. U-20898. November 21, 2024.

[10] Michigan Public Service Commission. Michigan Public Service Commission. Accessed May 28, 2025. https://www.michigan.gov/mpsc.

A New Lens for Assessing Cost-Effectiveness

A New Lens for Assessing Cost-Effectiveness

June 14, 2017 – by Julie Michals

The issue of determining the cost-effectiveness of energy efficiency resources has long been a complicated and sometimes contentious topic. Despite the perception that virtually all states nominally use some version of the tests identified decades ago by California, actual practice has been inconsistent and often subject to debate.

To address existing shortcomings and provide an updated and comprehensive approach, the first-ever National Standard Practice Manual (NSPM) was released on May 18th. Quickly named an “indispensable resource” by ACEEE, the manual’s debut has drawn considerable attention, and will be highlighted at a series of forthcoming events (see link below).

The Journey Part 1: Getting There from Here
As the NSPM’s foundation, the Resource Value Framework was published in 2014, with the vision that a comprehensive manual would follow. A publication of the National Efficiency Screening Project, the NSPM guides regulators and other decision makers on how to create a jurisdiction specific cost-effectiveness test for utility customer-funded efficiency programs.

I’ve had the privilege of working with some of the best minds while overseeing the 2017 development process – including five authors and a Review Committee representing a range of well-known expertise and critical perspectives. I sincerely thank the many commenters for their care and concern, and insightful suggestions for improving the manual’s multiple drafts. The end result, I believe, is a sound, objective guidance document that can help jurisdictions address cost-effectiveness assessment through a new lens.

What’s Different?
By “new lens,” I’m referring to how the NSPM’s starting point is not a pre-defined traditional test such as those that have been near and dear to our collective hearts (e.g. UTC, TRC test, and/or SCT.) Unlike the decades-old California Standard Practice Manual, the NSPM’s Resource Value Framework provides a starting point based upon a jurisdiction’s applicable policy goals. Using the steps set forth in the NSPM, a jurisdiction’s primary test may – or likely may not – be aligned with conceptual definitions of the traditional tests.

This is a fundamental shift from our traditional practice. The NSPM offers flexibility for jurisdictions to develop and apply a test that aligns with its unique goals. Importantly, it does not advocate for any particular type of test or for inclusion of any type of non-utility system cost or benefit. Rather, applying its framework and embodied principles will help jurisdictions identify and account for the relevant impacts according to their own policies. Stakeholders in each jurisdiction thus play the critical role of ensuring that applicable goals – and associated costs and benefits – are identified and appropriately incorporated.

What’s also different about the NSPM is that beyond presenting a new framework, it provides detailed guidance on a host of technical issues to assist jurisdictions in constructing and implementing their primary test.

The Journey Part 2: Change is Hard
Those of us long enough in the EE industry know that the topic of cost-effectiveness analyses is complex. Stakeholders have debated a host of issues over the years. And let me say, developing this new manual was no cake-walk, with many iterations and extensive back and forth on a range of views. Yet challenges were outweighed by constructive edits, compromises, and positive feedback as the first edition approached completion.

We all know change is difficult. When an industry has used or referred to certain practices for over two decades, changes to those practices, approaches and terminology take time.

Supporting change requires that industry players first understand the nature of the change. To this end, building understanding for the NSPM is an NESP priority. I invite you to download the manual and related materials, as well as view educational Webinars & Events designed to bring clarity to all involved. NESP will also develop case study examples to illustrate NSPM application.

Parting Thoughts
I hope this first edition of the NSPM brings you new perspective to cost-effectiveness analyses, especially at a time when our industry is evolving, and jurisdictions increasingly seek to broaden their assessment to a range of distributed resources.

Serving as current project coordinator, E4TheFuture intends that this objective manual can guide jurisdictions in their cost-effectiveness screening practices using a clear and transparent approach. Along with our partners and allies, E4TheFuture encourages jurisdictions to learn about the NSPM, and welcomes your questions and thoughts on this new document. If you are interested in following NSPM developments and updates, contact NSPM@nationalefficiencyscreening.org.

–Julie Michals is E4TheFuture’s Director of Clean Energy Valuation

DER Investments – Energy Affordability and Other Metrics

DER Investments – Energy Affordability and Other Metrics

By Ida Weiss, Synapse Energy Economics and Greg Ehrendreich, MEEAfrom NESP News, Feb. 2025

The project team of E4TheFuture, Synapse Energy Economics, and the Midwest Energy Efficiency Alliance (MEEA) is using the Distributional Equity Analysis (DEA) Guide develop two case studies in Illinois assessing how the costs and benefits of DER investments are distributed to different populations. The project is supported by staff from the Illinois Commerce Commission (ICC) and involves broad stakeholder input via Work Group meetings. A total of five meetings have occurred to date, covering stages 1-5 of the multi-stage DEA process shown in Figure 1. 

Figure 1. DEA Stages Overview

The Project Team is looking retrospectively at the energy efficiency (EE) and beneficial electrification (BE) plans from two of the largest utilities in Illinois – Commonwealth Edison (ComEd) and Ameren Illinois Company (Ameren). Stages 1-4 were addressed for both the BE and EE simultaneously. The Project Team is now focused on stages 5-7, which are being staggered, starting first with the BE plan DEA (currently at Stage 6), followed by the EE plan in spring 2025.  

Table 1. DEA Case Studies (Stages 2-3)

Stage 4 involved surveying and selecting DEA metrics, where the criteria used for selecting the metrics included: 

  1. Measurable utilizing existing data; 
  2. Available at the desired resolution (i.e. census tract, zip code, etc.); 
  3. Tied to local jurisdictional equity goals; 
  4. Focus on distributional equity impacts; 
  5. Avoid overlapping with BCA metrics and other DEA metrics; and 
  6. Have a direct causation-correlation relationship with the utility investment type being studied. 

The Project Team took both a top-down and bottom-up approach for selecting potential metrics to present to the Work Group. For ComEd’s EE plan, available data included program participation, energy savings, and utility dollars invested. For Ameren’s BE plan, data included participation, utility dollars invested, and avoided emissions. Available data was then compared to a list of potential DEA metrics to assess feasibility, based on metrics provided in the DEA Guide. The proposed metrics in Table 2 were presented to the Work Group for feedback and discussion.  

Table 2. Potential Metrics for the Two DEA Case Studies

Ameren BE DEA 

The Project Team first focused on presenting metrics and results for the Ameren BE DEA. The Project Team narrowed down potential metrics based on data availability, Work Group interest, and the six criteria listed above. Work Group participants highlighted the importance of including metrics relating to jobs and employment, non-energy benefits (i.e. benefits not relating to energy savings), and health impacts. As a result of Work Group feedback, the Project Team added analysis on the locations of existing EV chargers, calculated emissions reductions, and an overview of Ameren’s BE workforce development plan.  

The most recent December Work Group meeting focused on results for utility program investment, participation, emissions, and EV charger access for two key programs in Ameren’s BE portfolio: a time-of-use EV charging rate program and a program providing incentives for level 2 charger installations.  

Based on Ameren data, an estimated 18,000 vehicles will participate in the time-of-use EV rate program, with 26% of estimated participation occurring in EIEC and LI communities, as shown in Table 3. 

Table 3. Participation in Ameren’s TOU EV Program

Ameren estimates that 85% of all new chargers installed will be dedicated to EIEC/LI communities (roughly 4,800). Ameren’s EV charger rebate program includes funding for 60 publicly accessible chargers, as shown in Figure 2

Figure 2. Participation in Ameren’s EV Charger Rebate Program

To better understand the baseline for existing public charger access in Illinois, the Project Team mapped the existing locations of the 837 existing publicly accessible chargers using data from the National Electric Vehicle Infrastructure programFigure 3 shows the distance to the nearest publicly accessible charger by census tracts, with EIEC communities highlighted in teal. Overall, rural EIEC communities experience the least access to existing publicly accessible chargers at 13.9 miles from the nearest charger. The average across all Ameren is 7.4 miles. 

Figure 3. Distance to Nearest Publicly Accessible Charger

Next Steps 

By early March, the Project Teams will finish presenting Ameren results (specifically bill impacts) and summarize key takeaways. Future Work Group meetings (late March through May) will focus on the ComEd EE DEA analysis and results. The Project Team will finalize results in Q1 2025, with a full report on the two case studies expected in Q2 2025. More information is on the project website

Quantify DER Impacts and Accounting for Equity

Quantify DER Impacts and Accounting for Equity

(Continued from NESP News, November 2024)

The DEA guide’s primary purpose is to provide a framework that can be used to analyze equity impacts of DER investments to complement BCA results. How do BCA and DEA differ? The table below provides a comparison of the purpose of each analysis and example impacts/metrics.

A DEA can help decision-makers understand whether and to what extent DERs might deliver equitable net benefits for priority populations.

Want to learn more about DEA?

Sign up for a Virtual Live Training December 2-4, 2024. NESP offers training in partnership with AESP Academy. Come learn about DEA, including case studies from Washington State and Illinois. Register and see details.

Featured States Using the NSPM: Michigan and Maryland

Featured States Using the NSPM: Michigan and Maryland

(Continued from NESP News, November 2023)

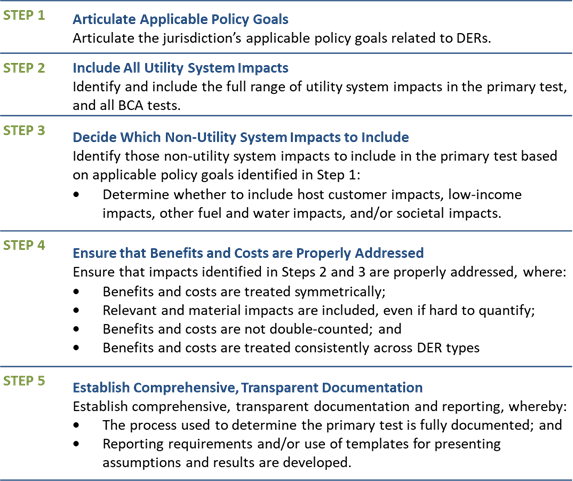
The table below summarizes each state’s approach in applying the NSPM framework. The key distinction is that in Maryland, a workgroup process is informing the development of its jurisdiction specific test (JST). Whereas in Michigan, the utilities developed a proposed JST at the direction of the commission, which stakeholders then commented on in response to a set of questions from the commission. While both states use the NSPM 5-step process, the Maryland approach involves stakeholder input throughout the multi-process, allowing for discussion of key BCA issues and with a goal of reaching consensus on which costs and benefits to include in the resulting jurisdiction specific test. Maryland’s process to date has taken longer than Michigan’s, primarily because it first updated cost tests for EVs and EE before opening the UBCA Docket 9674. Generally, however, the approach used by each state has taken (or will take) about two years from NSPM introduction to final commission orders adopting a consistent BCA test for all DERs.

MichiganMaryland
1. NESP presentation to Commission staff and stakeholders about NSPM BCA framework in the context of distribution system planning (DSP)1. NESP presentation to Commission and stakeholders about NSPM BCA framework
2. Commission staff make recommendation to the Commission to use the NSPM to develop a consistent BCA test for all DERs2. Commission directs utilities to develop BCA approach for EVs through stakeholder process, guided by NSPM
3. Commission issues order for utilities to develop BCA for DER pilots guided by the NSPM. Utilities retain a consultant to develop BCA using NSPM multi-step process and files proposal with commission, recommending the proposed MI jurisdiction specific test (JST) be applied at scale.3. NSPM principles are applied to inform development of BCA for EVs and then to EE (EMPOWER programs). Commission approves a MD-EV JST (2021), and separately a MD-JST for EMPOWER programs (2022). Commission staff recommend that the Commission open a docket to develop a UBCA test for all DERs
4. Commission invites public comment on the utilities’ proposed BCA, focusing on key questions including impacts to include in a consistent BCA test, methodologies to account for impacts, and whether to develop a transparent BCA spreadsheet tool.4. Commission opens docket (Jan 2022) to develop a UBCA for all DERs in range of regulatory contexts using NSPM, building on EV and EE BCAs. Requests public comment and issues order convening workgroup and issuing RFP for facilitation services.
5. Interested stakeholders file comments responding to Commission’s set of questions.5. Commission staff select consultant to facilitate a workgroup using NSPM multi-step process, comprising up to 8 workgroup meeting (four have been completed as of mid-November)
6. Commission issues order adopting a benefit-cost test based on the utilities’ proposed JST with modifications per stakeholder comments, ensuring alignment with Michigan’s energy goals.6. Based on workgroup input, consulting team to develop UBCA straw proposal for workgroup review and modifications, Commission staff to submit UBCA to Commission for approval (Q1 2024)
Timeframe: Fall 2021 – Fall 2023Timeframe: Spring 2021 – Winter 2024 (anticipated)

More detail on each state process, key issues raised, and a final determination (for Michigan) is provided below.

Michigan

Case U-20898 – In the matter… to commence a collaborative to consider issues related to implementation of effective new technologies and business models. To recap previous NESP News, the Michigan Public Service Commission’s (MPSC) issued a July 2022 Order requiring the utilities to develop a Michigan specific benefit-cost test for pilot DER programs, guided by the NSPM. DTE Electric Company and Consumers Energy submitted (with support from a consultant) a joint Proposed Requirements and Further Guidance on Benefit-Cost Analyses for Pilot Initiatives using the NSPM five-step process to develop a jurisdiction specific test (JST). The MPSC requested public comments—via an April 2023 Order—focusing on six questions about the proposed utilities’ plan. Comments were submitted by utilities, the Michigan Energy Innovation Business Council (MEIBC), the Midwest Energy Efficiency Alliance (MEEA), and the American Council for an Energy-Efficient Economy (ACEEE).

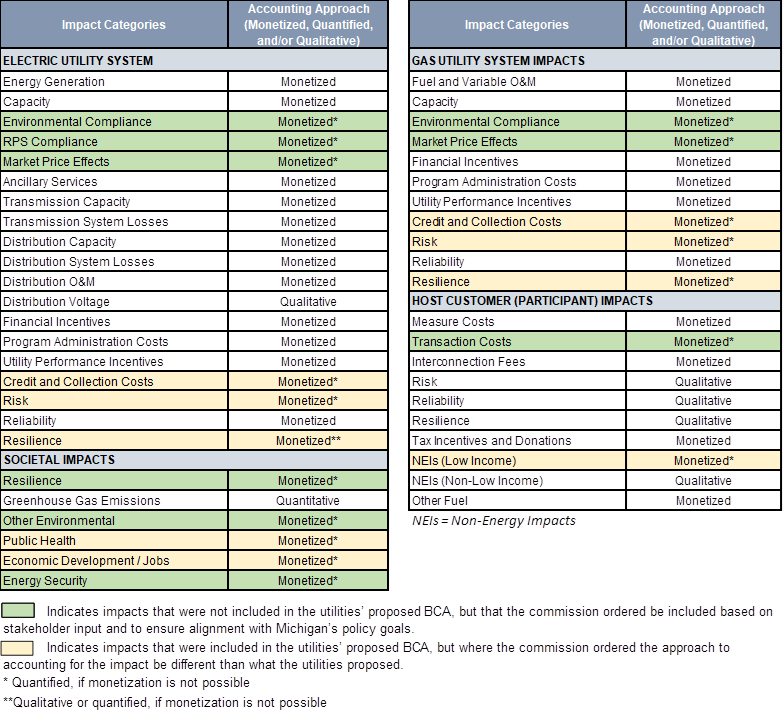
The Commission issued an October 2023 Order largely adopting the utilities’ proposed BCA test, but with changes based on intervenor comments. A summary of the BCA impacts to include in Michigan’s approved BCA JST (which the commission also refers to as the “Societal Test”) is provided in the table below, highlighting which impacts were added to ensure alignment with Michigan’s applicable policies (consistent with NSPM principles), as well as direction on methodologies for accounting for impacts—whether monetization, quantitative or qualitative. The Commission also decided on a societal discount rate from 0-3%, rather than a weighted average cost of capital (WACC), as the utilities had been ordered to develop a test based on societal impacts, rather than the impacts on a utility (for which the WACC would be more appropriate)—again, consistent with NSPM guidance.

Finally, the MPSC ordered the development of a flexible and transparent spreadsheet-based tool to measure the cost-effectiveness of DER programs, through a collaborative process including commission staff, utilities, and stakeholders. It also supported the use of additional resources such as NESP’s Methods, Tools and Resources (MTR) handbook and forthcoming guidance on conducting a Distributional Equity Analysis (see separate article).

Commission April 2023 Order Questions:*

  1. Are necessary elements missing from the BCA proposal? Are there additional impact categories which should be considered? 
  2. Are the utilities’ proposed treatment (monetized, quantitative, and qualitative) for each BCA impact appropriate?
  3. Is the utility proposal’s assumed after-tax WACC the appropriate discount rate to use?
  4. What, if any, changes to the BCA proposal are required in order for natural gas utilities to make use of the BCA proposal for pilots?
  5. Do stakeholders find value in the development of a spreadsheet-based tool for both the Staff and utility personnel to utilize?
  6. Are there regulatory examples of JST or BCA developments in other states that could be instructive for use in Michigan?

*abbreviated

Michigan’s Jurisdiction Specific Test

Maryland

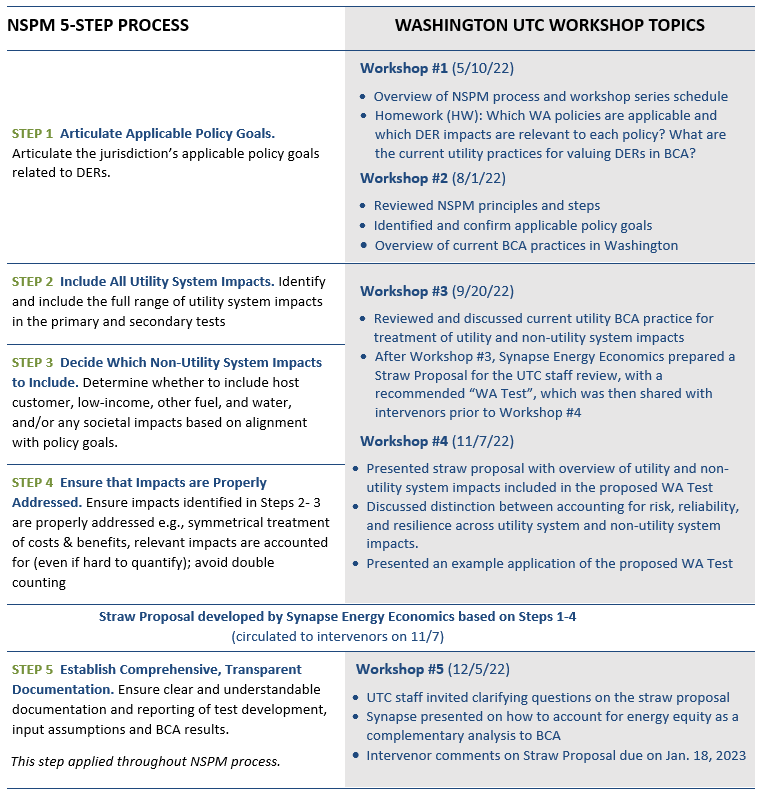
The Commission opened the Unified BCA docket (Case No. 9674) in early 2022, and then convened a workgroup (Order 90212) directing utilities to issue an RFP on its behalf to retain workgroup facilitation services. E4TheFuture and its project team (comprising Energy Futures Group, Rábago Energy, Steven Schiller Consulting, and AnnDyl Policy Group) was contracted to provide facilitation and technical services to support the UBCA workgroup process. Four workgroup meetings were held from July to October 2023. The kick-off meeting reviewed the NSPM 5-step process and the commission’s directive on a UBCA framework, per its Order 90212, including that:

  • “A UBCA will better align energy efficiency, demand response programs, and long-term infrastructure planning with State climate and equity efforts and encourage programs that fulfill the needs of the grid and the goals of the State.
  • A UBCA framework may also assist the Commission and stakeholders to identify the least-cost means to achieve Maryland policy goals…
  • The purpose of the UBCA is to better inform stakeholders and the Commission about available choices that will promote the realization of State goals and policies.
  • A UBCA should also increase transparency and efficiency in the assessment of energy resources.
  • The UBCA should not be designed to substitute for the utilities’ independent, experienced judgment as to how to maintain safe and reliable service on utility systems.
  • The goal of developing a consistent framework does not mean that the test must be identical across different DERs and utilities. There may be impacts (benefits or costs) that are unique to a given DER. Likewise, there may be impacts (benefits or costs) that are unique to a given utility.
  • Additionally, the Commission does not intend to surrender its discretion by adopting an inflexible mathematical formula that would mandate the approval or rejection of a given project.”

The workgroup reviewed a preliminary list of policies (building upon policies that informed Maryland’s development of a Statewide EV BCA Methodology and EMPOWER Maryland JST for energy efficiency), and were asked to identify priority policies that should be used to inform the development of a UBCA for all DERs, as well as any missing policies.

Maryland’s Initial List of Applicable Policies

–Clean Transportation and Energy Act of 2023 (Chapter 98 / HB 550)
–Maryland Sustainable Buildings Act of 2023 (Chapter 586 / HB 6)
–Climate Solutions Now Act of 2022 (Chapter 38 / SB 528)
–MD PSC Order No. 90261
–MD PSC Acceptance of EV BCA Framework in Case No. 9478 – PC44 ML# 238013
PC44 Transforming Maryland’s Electric Grid
–Utility Regulation – Consideration of Climate and Labor (Chapter 614 / House Bill 298 of 2021)
MCCC Building Energy Transition Plan (November 2021)
–The Shirley Nathan-Pulliam Health Equity Act of 2021 (Chapter 750 / SB 52)
2030 GGRA Plan (February 2021)
–Energy Savings Goals for State Government – 2020 (Chapter 289 / HB 662)
2020 Annual Report of the Commission on Environmental Justice and Sustainable Communities
–Clean Energy Jobs Act of 2019 (Chapter 757 / SB 516)
–Energy Storage Pilot Project Act of 2019 (Chapter 427 / SB 573)
2020-2024 Maryland WIOA State Plan
–Greenhouse Gas Emissions Reduction Act (GGRA) of 2016 (Chapter 11 / Senate Bill 323)
–MD PSC Order-No.-87082 from 2015
–MD Code, Public Utilities § 7–211(b) EmPOWER Act
–MD Code, Public Utilities § 7-213
–MD Code, Environment § 1-701

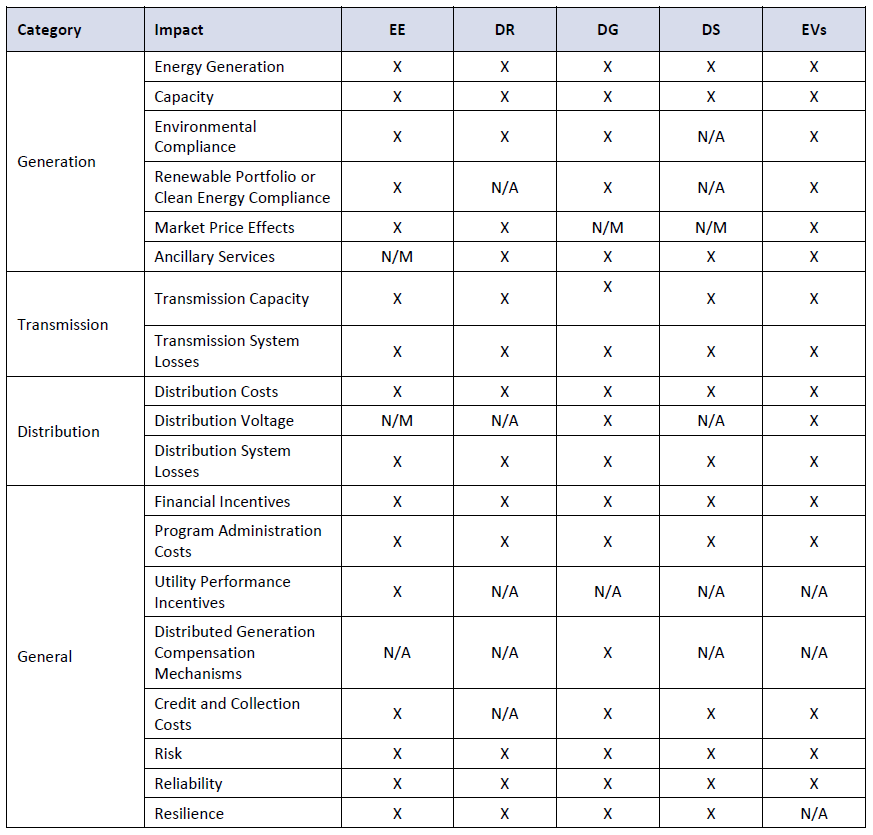
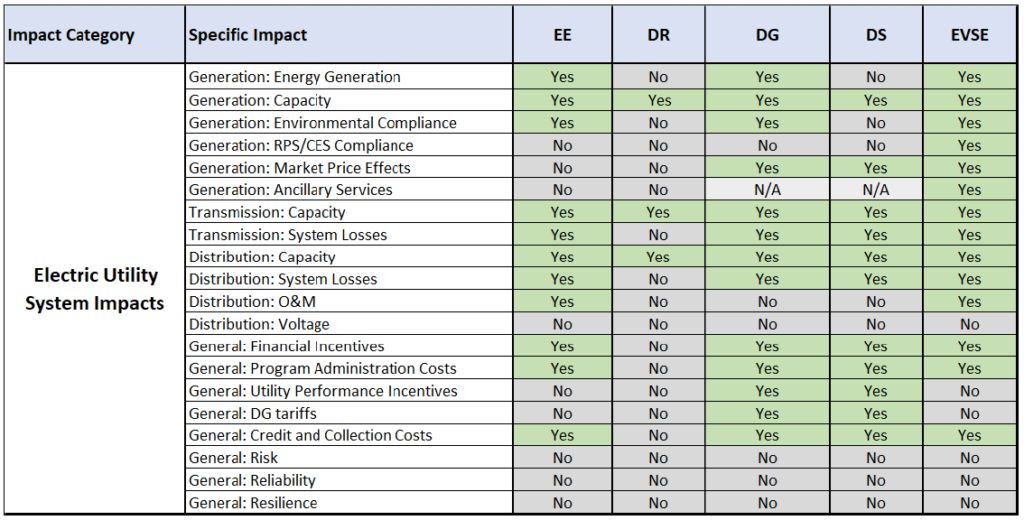
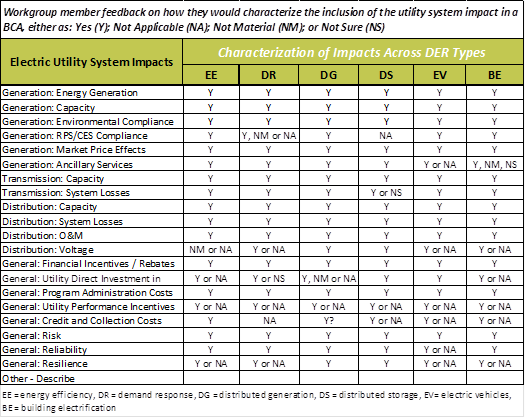
The second and third workgroup meetings reviewed utility system impacts, current BCA practice, and the applicability of impacts to different types of DERs. The table shows the collective feedback of the workgroup and how they characterized the applicability of impacts. Facilitated discussion helped to clarify key differences.

This process helped to illustrate that a consistent BCA for all DERs does not mean the same impacts apply across all DERs, but rather that the full range of utility system impacts should be part of a BCA, with transparency about which apply or do not apply, or are considered immaterial to include.

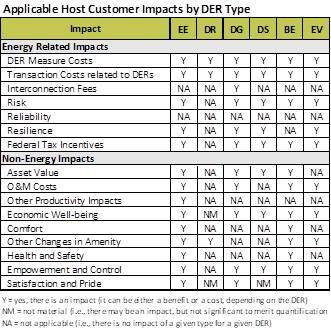
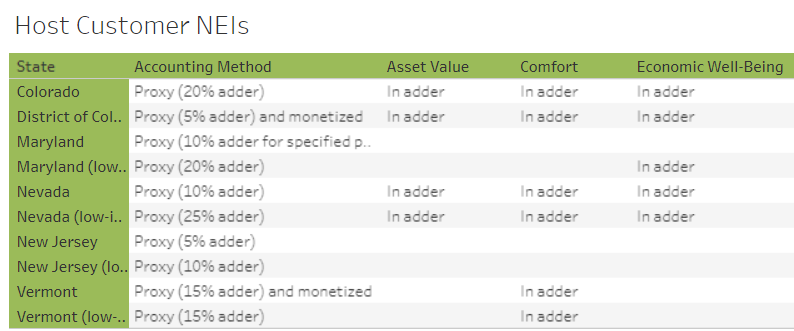
The fourth workgroup meeting reviewed non-utility system impacts (non-USIs) – i.e., other fuels, host customer, and societal impacts – and their relevance to Maryland’s applicable priority policies and to specific DERs. Discussion included the applicability of host customer (participant) impacts to different DER types, and the importance of ensuring symmetry (NSPM Principle #3) in the accounting of both host customer costs and benefits – recognizing the challenge of monetizing certain benefits – should the workgroup decide to include host customer impacts in a proposed UBCA to the commission.

The workgroup was polled on the relevance of non-USIs to the inventory of priority policy goals using the key criteria noted above; the results of workgroup feedback—with NSPM guidance—are informing a draft straw proposal being prepared by the consulting team for review and further workgroup input in December.

Revisiting Lost Revenues and Cost-Effectiveness Testing in a World of Expanding DERs

Revisiting Lost Revenues and Cost-Effectiveness Testing in a World of Expanding DERs: Lessons from the Frontlines of Benefit-Cost Analysis

by Karl R. Rábago, Rábago Energy

There are few topics in modern rate regulation more controversial than the ongoing debate about the growth in deployment and operation of distributed energy resources, or “DERs” and the associated potential of lost and/or gained utility revenues, and how to treat them in rates, program design, and program evaluation. DERs are energy resources deployed at the distribution level of the utility grid and include distributed generation, distributed storage, energy efficiency, demand response, electric vehicles, and energy management. Lost revenues represent the money that a utility expected to collect from customers under approved rates that it will not collect—at least until, and if, a regulator approves changes in rates or charges—because the DERs resulted in a reduction in use of energy. The reverse applies in cases where a utility may “gain” revenues from, e.g., building or transportation electrification.

As brief and tidy as these definitions are, the issue of lost or gained revenues impacts associated with DERs has become a hotbed of argument, confusion, frustration, and not just a few controversial regulatory pronouncements and decisions. To this frequent trainer, debater, and expert witness on the topic, it seems time to address the topic again, and with hope that more of us will approach the issue from a position of more common understanding.

Framing the issue – the basics

First, it is important to frame the issue and not just define the terms. Regulated utilities live on the recovery of revenue requirements. Revenue requirements in turn reflect the return of and on investments made by utilities to provide utility service. Revenue requirements are determined primarily in rate cases, though sometimes also in associated or alternative regulatory proceedings, such as formula rate adjustments, tariff adjustment mechanisms, riders, and performance-based regulation decisions.

For example, if a utility invests $1,000,000,000 to build a new substation, and that substation is used and useful in the provision of electric service, and that spending is approved by a regulatory authority, then the utility will be entitled to recover the money spent plus a return on or profit on the investment. That return will be spread out over the expected useful life of the substation—say 40 years. If the utility spends $100,000 paying for miscellaneous consulting services and the spending is likewise approved, the utility will be entitled to recover that cost, though generally not with a profit, because consulting fees are an operating expense and not a capital investment. Both the annual share of the cost of the substation and the consulting fees will be included in the revenue requirement for the utility. And the utility is entitled—as a matter of U.S. Constitutional law, no less—to a reasonable opportunity to earn its revenue requirement. These and other amounts are the cost of electric service, and the approach I just described is known as cost-of-service regulation.

How the utility recovers or collects its cost of service is referred to as “rate making,” that is, the apportionment of the costs to the customers that use or benefit from the service provided. And the mechanism for cost recovery is dividing approved costs—approved revenue requirement—by the number of energy units the utility expects to sell in the time following the approval of rates.

So, if our example utility has a $27,350, 000 annual revenue requirement (1/40th of $1,000,000,000 for the substation, plus, say, 9% profit on the annual amount, plus $100,000 for the consulting fees), and it expects to sell 273,500,000 kWh of electricity at a single uniform rate, then it will be authorized to charge its customers 10 cents per kWh by the regulators. And if the utility sells exactly 273,500,000 kWh of electricity, it will recover its revenue requirement exactly.

Of course, this is a highly simplified example. There are many kinds of costs that the utility incurs to provide electric service, and there are many kinds of customers rates and charges that a utility uses to recover its cost of service. And there are many reasons why the actual level of sales that occur after rates are approved will not match the forecasts—the weather and economic conditions being chief among them. It is also possible that the forecast itself was simply wrong, for whatever reason.

These deviations from planned revenue recovery seldom move in the same direction. A particularly hot summer could drive sales higher due to increased use of air conditioning but could also motivate some customers to make significant changes in how much energy they use, such as by adding insulation or getting a more efficient air conditioner.

Generally speaking, utilities take the ups with the downs and get pretty close to meeting their approved revenue requirement. And if their earned revenue is consistently lower, or higher, than the approved revenue requirement, many adjustments/fixes are available.

Enter Distributed Generation (DG) – increased costs vs. lost revenues

Just like energy efficiency, personal conservation habits, and/or changes in household makeup—which can persistently change usage levels and patterns—customer-sited distributed generation (DG) can permanently change the usage in a particular customer home or business. Generally, sales to customers with onsite generation go down, especially during the sunny hours of the day if the generation is solar-powered. Sales go down with efficiency and conservation, but could go up due to demand response programs, building electrification (e.g., air source heat pumps), EV adoption, and use of distributed storage.

In the case of DG—which is the focus hereafter—if the utility did not forecast, or underestimated, the adoption of customer-sited DG in its last rate case, sales will fall below the forecast level (all other things being equal). When those sales fall, and if nothing else happens, the utility will face a revenue shortfall as compared to revenues assumed in that last rate case.

So, if the utility does not earn as much as it expected due to the unexpected or underestimated installation of distributed generation, why does that matter? And is that a cost?

DG can provide benefits to the utility and non-DG customers. Overall, reduced use of the grid and utility generation as a result of DG operation can save everyone money over both the short and long term. Transformers wear out faster on hot sunny days when they operate at or above the upper limits of their design. Hot summer weather causes peak demand for energy across entire regions, which in turn requires provision of the most expensive generation and increases overall system stress and can be counteracted by local distributed generation. These are beneficial impacts of distributed generation that, among others, should be accounted for in evaluating whether the utility system and society benefit from distributed generation.

But what about the cost to the utility of distributed generation? Utilities can incur costs related to distributed generation. High concentrations in particular locations can require spending on system upgrades. These added, incremental costs of distributed generation are typically charged to customers seeking to interconnect their generation systems to the grid. But if the utility incurs costs that it does not pass back to the generator, then it faces a cost. And if the utility did not plan for that cost in its last rate case, it could have an earnings shortfall.

The reduction in sales, however, is not by itself a cost. A cost is an added financial burden associated with a particular event or action. Not selling as much electricity as planned is not an added cost of serving customers, even for the customer who installs the distributed generation. The reduction in sales does not increase the cost of service.

“Not selling as much electricity as planned is not an added cost of serving customers, even for the customer who installs the distributed generation. The reduction in sales does not increase the cost of service. The operation of an interconnected distributed generation does not add a cost to utility operations just because expected sales are reduced. So, in the business of performing a benefit-cost analysis, lost sales have no place. Lost revenues, by themselves, are not a cost or a benefit of distributed generation.”

The operation of an interconnected distributed generation does not add a cost to utility operations just because expected sales are reduced. So, in the business of performing a benefit-cost analysis, lost sales have no place. Lost revenues, by themselves, are not a cost or a benefit of distributed generation.

If lost revenues are not a cost or a benefit for including in a BCA, what are they?

Lost revenues due to sales reductions could have an impact on the utility and other customers. The utility could have a revenue shortfall and be forced to reduce spending or find new sources of revenue to do all the things it planned. One of the sources of new revenues could be other customers who do not have generators of their own, or to seek increases in rates—in the next rate case—for all customers, including those with generators.

This raises the oft cited and inaccurately named concept of a “cost shift.” The notion behind cost shift concerns is that if a utility does not earn its planned and approved level of earnings, even after trying to forecast for such impacts in the last rate case, due to self-generation, then the recovery of the costs that the utility would otherwise recover from customer-generators will be shifted to other customers without generation.

The cost shift argument, therefore, expressly assumes that the utility is entitled to all the money it would have made on a customer, even if that customer pays less due to self-generation. Often, the argument speaks in terms of customer-generators paying their “fair share” of utility sunk costs. And far too often, the argument does not include an evaluation of the net benefits and costs of distributed generation.

If a utility is subsequently allowed to recover lost revenues, and the distributed generation customer continues to use less of utility services, three important questions arise.

  • First, did the self-generator reduce utility costs by using less electricity, and to what extent?
  • Second, does a redistribution of those reduced costs to other customers amount to fair, just, and reasonable rate making for non-generator customers?
  • Third, does the redistribution of costs to non-generators have distributional impacts that unjustly burden non-generator customers?

Answering these questions is the stuff of rate impact analysis, whereas BCAs answer the question: Which resources have benefits that exceed costs and therefore merit utility acquisition or support on behalf of their customers?

“Taken together, we can see that the best course is to fully evaluate the costs and benefits of distributed generation in terms of impacts on the utility and other customers, and on society as a whole [. . .] Then, and in parallel, undertake a rate impact analysis to determine whether an actual cost shift will arise, whether the utility should be authorized to collect lost revenues, and whether that collection will have unacceptable impacts, net of benefits, on non-generators.”

Taken together, we can see that the best course is to fully evaluate the costs and benefits of distributed generation in terms of impacts on the utility and other customers, and on society as a whole (to extent applicable to a jurisdiction’s articulated societal policy goals). Then, and in parallel, undertake a rate impact analysis to determine whether an actual cost shift will arise, whether the utility should be authorized to collect lost revenues, and whether that collection will have unacceptable impacts, net of benefits, on non-generators.

Doing a rate impact test without a BCA ignores the long-term and system-wide benefits that distributed generation can bring. And as distributed generation markets grow, evaluating rate and distributional impacts is essential to ensuring just and reasonable utility service rates for all. This evaluation should align with NSPM principles, especially in accounting for the full range of utility system impacts, and, where consistent with jurisdictional policy goals, also in accounting for host customer and societal impacts.

What if rates increase? If the potential level or distribution of rate increases for non-generators is unacceptable, the regulator and the utility have options. They can limit distributed generation with system-wide caps or by imposing charges on distributed generation that makes customer investments in generation less attractive. They can also work to expand the pool of customers that can benefit from self-generation, such as with special incentives for target customers (which can add a cost) or with support for community or shared generation programs. They can seek to maximize the value of installed self-generation with “Value of DER” rates that encourage siting and operation to maximize locational and temporal benefits of distributed generation. And they can include customer-hosted distributed generation in non-wires solutions programs aimed at avoiding or deferring specific and imminent infrastructure costs. Finally, because distributed generation and other distributed resources enjoy economies of deployment scale—they get less expensive with higher deployment rates—they can target programs to accelerate distributed generation deployment. Though this last option sounds counterintuitive, more affordable distribution generation means deployment rates won’t suffer if rates for self-generators are adjusted to increase the amount that these customers pay to the utility even after self-generation.

Closing Thoughts…

Despite all-too-common misperception, utilities are not guaranteed their income or their profits for shareholders. Well-established law provides that they are only entitled to a reasonable opportunity to recover their investments and money spent providing utility service, and to earn an allowed level of profit on some of that spending associated with capital—long-lived investments. So, the regulator and the utility are faced with a series of questions when customer-sited / customer-owned generation is installed and operated. These questions include:

  • What does jurisdictional policy say about distributed generation? Is distributed generation part of the state’s plan for decarbonization?
  • With all the other things that impact revenues, is dealing with distributed generation impacts on revenues a policy priority?
  • Did the utility anticipate the installation and operation of the distributed generation? (if the generation is in the forecast, the lost sales are already accounted for)
  • Were the sales and earnings impacts material to the utility’s ability to recover its revenue requirements? (hot day – increased sales and solar generation)
  • What else happened with sales and earnings to offset or compound the earnings impacts the utility has seen?
  • Should distributed generation revenue impacts be treated similarly or differently from all the other things that affect sales and earnings?
  • Are there already mechanisms in place, like revenue decoupling, which will adjust earnings for unanticipated shortfalls?
  • Will limits on distributed generation, or changes in distributed generation rates reduce or preclude the system-wide benefits that distributed generation can provide?

The issue and treatment of lost revenues versus benefit-cost analysis is critically important to understand, not only for regulators and utilities, but also the stakeholders interested in the merits and impacts of utility DER investments.

As the deployment and operation of DERs continues to grow, with many customers deploying more than one DER at a time, a BCA framework that aligns with the National Standard Practice Manual principles, coupled with rate impact analysis (Appendix A of the NSPM), is essential to avoid rate and revenue surprises and unfair burdens. And a clear understanding of the different purposes and methods of benefit-cost analysis and rate impact analysis is essential.

DSP: NEI and GHG Impact Comparisons

DSP: NEI and GHG Impact Comparisons

(Continued from NESP Quarterly February 23, 2023)

In the case of host customer NEIs – which are typically difficult to quantify – the Database of Screening Practices shows us that many states use a proxy adder as a methodology to account for various types of NEIs. States like Colorado and Nevada utilize adders to account for the full range of host customer NEIs from their energy efficiency programs, while other jurisdictions utilize adders to account for specific impacts, such as Maryland’s health and safety adder.

The new DSP table summary shows the proxy adder values used by states, ranging from 5% to 25%. However, application of the adders varies: some states apply an adder to only low-moderate income (LMI) program impacts, while others apply broadly to all residential programs; in states that use a proxy adder across residential programs, the value applied to LMI programs may be higher than for non-LMI programs.

In the case of how jurisdictions account for carbon emission impacts in BCAs for efficiency programs, there is considerable variation in the methodologies and values used. Our research shows that jurisdictions often account for carbon emissions as an avoided utility system cost, either embedded into their avoided generation/distribution costs or as an avoided environmental compliance cost.

For states with carbon cap-and-trade systems, such as the Regional Greenhouse Gas Initiative in the Northeast, this value encompasses the cost of compliance with the cap-and-trade system. Other jurisdictions choose to account for carbon as a non-utility system impact (i.e., societal impact). When treated as a societal impact, we found that carbon emissions are often valued higher than when accounted for as a utility system impact. This may be due to the fact that many jurisdictions utilize the Social Cost of Carbon to value societal carbon emissions, which encompasses the full range of damages from carbon emissions that are often not captured as a utility system impact. Some jurisdictions account for avoided carbon emissions as both a utility system impact and a societal impact. This practice allows jurisdictions to account for the avoided impacts of carbon emissions to the utility system as well as other societal impacts, and can avoid double counting when performed correctly. See the MTR Handbook (Chapters 3.2 and 7.1) for guidance on accounting for GHG emission impacts.

Access the DSP and the new comparison tables here.

States using the NSPM: Washington

States using the NSPM: Washington

(Continued from NESP Quarterly February 23, 2023)

The table below lays out the NSPM 5-step process and the associated workshop series and topics, illustrating specific Washington priorities. The first two workshops provided an overview of the NSPM process and served as a forum for stakeholders to discuss applicable WA policy goals, relevant impacts, and current utility BCA practices. During the third workshop, stakeholders reviewed and discussed current utility BCA practice for treatment of utility and non-utility system impacts and identified which impacts should be included in a primary BCA test.

Synapse Energy Economics incorporated feedback from workshops 1-3 to develop a draft straw proposal with a recommended “WA Test” for UTC Staff and other stakeholder review. Synapse presented this proposal and an example application of the WA Test during the fourth workshop.

Key aspects of the proposed WA Test include adhering to the NSPM core principles, such as aligning with WA’s applicable policies, ensuring symmetrical treatment of costs and benefits, accounting for relevant impacts (even if difficult to quantify), and avoiding double counting of any impacts.

Importantly, the straw proposal demonstrates how a primary WA Test would apply across different DERs, where not all impacts are relevant (N/A) or material (N/M) to each DER (or use case). Table 8 from the straw proposal (below) shows how the full range of utility system impacts should be part of the WA Test, but where depending on the DER, certain impacts may or may not be applicable. Similar tables are provided for Host Customer and Societal Impacts.

Next Steps:

The fifth UTC workshop provided a forum for the intervenors to ask clarifying questions and provide feedback on the straw proposal. Synapse also described how to account for energy equity as a complementary analysis to BCA. With energy equity as a top policy priority for the state, Synapse is providing technical assistance to WA UTC (via LBNL) to assist with addressing distributional equity analysis (see newsletter information on new DEA project).

Following the last workshop, UTC staff issued a notice of opportunity for written comments on various aspects of the straw proposal and proposed test. Its notice included over 20 questions asking intervenors to comment on the following range of issues:

  1. Whether changes are needed to current BCA practice in WA to ensure consistent evaluation of DERs, and if so, whether a JST is necessary to align with the Commission’s policy goals.
  2. General feedback on utility system impacts (electric and gas), and questions regarding specific definitions for and accounting for environmental compliance and renewable portfolio impacts.
  3. General feedback on non-utility system impacts, including Other Fuels, Host Customer Impacts and Societal Impacts.
  4. Treatment of highly impacted communities or vulnerable populations and associated impacts as a separate category relative to low-income customers.
  5. Definitions for applicable societal impacts, including GHG emissions, Other Environmental, Public Health and Energy Security impacts.
  6. Treatment of Risk, Reliability and Resilience, and appropriate definitions and relevance to utility system, host customer and societal impacts.
  7. Application of the WA Test, and whether it should be formal or informal.
  8. Value of a Phase 2 process to address methodologies for quantifying DER impacts (using the NESP’s Methods, Tools & Resources Handbook); best process for addressing Phase 2 issues.

Formal intervenor comments were due on the straw proposal January 18, 2023. UTC staff are reviewing comments with a determination and/or next steps expected this spring. All docket and workshop meeting materials are posted to the WA UTC website for Docket UE-210804.

How Are States Using the NSPM?

How Are States Using the NSPM?

(Continued from NESP Quarterly October 5, 2022)

Minnesota

The table below summarizes the MN NSPM workshops to date. These are facilitated by the Department of Commerce (DOC) staff with support from the DOC’s lead consultant, Mendota Group, and with technical assistance from Synapse Energy Economics (“Synapse”) on NSPM application (funded by US DOE/LBNL). Stakeholders in the Cost-Effectiveness Advisory Committee (CAC) include utilities, state agencies, and nearly 20 other interested organizations.

The first two workshops, led by Synapse, walked the CAC through the key steps of identifying what impacts to include in Minnesota’s primary cost-effectiveness test. This process informed Synapse’s development of a straw proposal with a new Minnesota Test (MN Test) for stakeholder review. The third workshop focused on stakeholder feedback on the straw proposal. With this input, Mendota prepared a draft Working Group Report that incorporated the straw proposal and stakeholder comments, along with DOC staff’s recommendation for a new Minnesota Test (MN Test) and use of secondary tests, as required by statute.

With the draft MN Test in place, the CAC has moved to the next phase of the NSPM process, which is to identify methodologies to quantify impacts for use in cost effectiveness. As presented by Synapse in Workshop #5, this effort will refer to the MTR Handbook (a companion resource to the NSPM) to guide selection of appropriate methodologies for quantifying various impacts. Identifying methods to account for relevant impacts in this phase will be informed by white papers developed by the utilities and others in the following areas:

  1. Develop Utility System Impacts values and document how factors are calculated and incorporated into BCA modeling.
  2. Develop Non-Utility System Impacts values and document how factors are calculated and incorporated into BCA modeling.
  3. Develop Efficient Fuel-Switching and Load Management Cost-Effectiveness Guidelines, and apply approach adopted for the MN Test to evaluate Efficient Fuel-Switching and Load Management programs.
  4. Determine Discount Rates to use in cost-effectiveness analyses, informed by previous MN guidance.

The DOC anticipates that the CAC will have four more meetings in 2022, with the CAC process concluding by January 2023. Near the conclusion of the CAC process, there will be a formal regulatory process set by Minnesota rules and statute. During this regulatory process, the DOC will develop a written Staff Proposed Decision with recommendations about cost-effectiveness methodology updates, followed by a public comment period. In early 2023, the Department will issue the Deputy Commissioner’s Final Decision filing, which will set the cost-effectiveness assumptions that the utilities will be required to use for their 2024-2026 CIP Triennials.

To learn more about the Minnesota’s experience applying the NSPM BCA framework, read our previous newsletter coverage and see MN NSPM workshop materials

Washington

Since kicking off the NSPM process at its May 10 Workshop in Docket UE-210804, the Washington Utilities and Transportation Commission (UTC) convened stakeholders on August 1 and September 20 to bring cost-effectiveness testing practices into alignment with applicable policies — in particular, related to the state’s CETA statute and Climate Commitment Act – and to support clean energy rule requirements. The summer workshop agendas generally followed the NSPM 5-step process as shown below, while illustrating specific Washington priorities. As it takes steps to review and update its BCA practices, Washington aims to ensure it can meet its policy needs.

Workshop #2 Agenda (August 1, 2022)

Workshop #3 (September 20, 2022)

During Workshop #3, stakeholders reviewed and discussed current utility BCA practice for treatment of utility and non-utility system impacts, using Puget Sound Energy data as reported below (and similar tables for host customer and societal impacts. 

The concluding workshop assignment from UTC staff was a request for the utilities to indicate, where utility system impacts are not included in current BCA practice, the reason for exclusion — e.g., due to lack of data, or impacts considered not applicable or not material. In cases where an impact is applicable and material, utilities are asked to recommend a general approach/method for quantifying or accounting for the impact.

Subsequent to Workshop #3 and additional information requested from the utilities, a Straw Proposal will be developed by Synapse Energy Economics (via LBL funding for state technical assistance) and will be circulated to stakeholders for comment and discussion at a workshop scheduled for late October.

Additional workshop topics to be addressed during the NSPM process include use of secondary tests, selecting discount rates, and accounting for energy equity. All docket and workshop meeting materials are posted to the WA UTC website for Docket UE-210804. For more information on the WA process, see our previous newsletter coverage.

Maine

Pursuant to Public Law 2021 Chapter 390 (LD 936, An Act To Amend State Laws Relating to Net Energy Billing and the Procurement of Distributed Generation), the Governor’s Energy Office convened the Distributed Generation (DG) Stakeholder Group to issue recommendations that support continued development of renewable energy in Maine through cost-effective distributed generation, including meeting a goal of 750 megawatts (MW) of DG under the net energy billing programs established in 35-A MRS §3209-A and §3209-B.

Per LD 936, the charge of the DG Stakeholder Group is to “consider various distributed generation project programs to be implemented between 2024 and 2028 and the need for improved grid planning.” The DG Stakeholder Group produced an interim report in December 2021 establishing initial areas of consensus and describing a framework and intended design process for a successor program. The areas of consensus included articulating clear policy goals based on legislation, and recognizing the importance of accounting for DG potential benefits to the electric system, as well as to the state — through avoided costs, plus resilience, environmental, public health, and economic benefits.

Synapse Energy Economics will provide technical analysis to fulfill the requirements of LD 936 Section 4 as specified in the RFP, provide technical and program design support for the development of the DG program, and facilitate stakeholder engagement to obtain and incorporate public input.

Monetizing Societal Health Impacts in BCA – Guidehouse Shares Illinois’ Methodology

Monetizing Societal Health Impacts in BCA – Guidehouse Shares Illinois’ Methodology

(Continued from NESP Quarterly October 5, 2022) — In this article, guest writer Patricia Plympton, Associate Director at Guidehouse outlines the methodology used by Guidehouse to monetize societal health impacts for the BCA of ComEd’s energy efficiency portfolio. ComEd was the first IOU to include societal health impacts in BCA tests in alignment with Illinois policies using a relatively low-cost approach applicable to any electric or gas utility.

In 2016, the Illinois legislature passed the Future Energy Jobs Act (FEJA), and with this passage, Commonwealth Edison (ComEd) requested Guidehouse, their independent evaluator, to conduct non-energy impacts (NEIs) research to quantify and monetize NEIs, such as societal health impacts, to include in total resource cost (TRC) tests. This was reaffirmed in 2021 with the passage of the Climate and Equitable Jobs Act (CEJA), which directed the utilities to continue to include societal health NEIs in TRC tests and to report economic NEIs. The CEJA legislation explicitly set forth that:

“The plan shall be determined to be cost-beneficial if the total cost of beneficial electrification expenditures is less than the net present value of increased electricity costs …[including] the societal value of reduced carbon emissions and surface-level pollutants, particularly in environmental justice communities.” “The independent evaluator shall determine…an estimate of job impacts and other macroeconomic impacts of the efficiency programs for that [plan] year.”

Energy efficiency programs result in many benefits beyond direct energy and demand impacts, including those related to public health. Energy generation from fossil fuel sources leads to emissions of several harmful pollutants such as PM2.5, SO2, NOx, and CO2. These pollutants have several implications for public health, including:

  • premature death,
  • chronic and acute bronchitis,
  • non-fatal heart attacks,
  • respiratory or cardiovascular hospital admissions,
  • upper and lower respiratory symptoms, and
  • asthma, and asthma-related hospital visits.

Although utilities in several states have used one or more categories of monetized NEIs in their cost-effectiveness tests, Illinois is the first state—in alignment with its policies—to include monetized societal health NEIs in their cost-effectiveness tests. Guidehouse recently published an Evaluation of ComEd’s CY2020 Total Resource Cost Test which includes a years-long research project to quantify and monetize the societal health NEIs as a result of ComEd’s energy efficiency programs. Guidehouse’s methodology and the results of incorporating societal health NEIs into their Benefit Cost Analysis (BCA) are described below. 

Methodology for Monetizing Societal Health NEIs

To measure societal health NEIs and incorporate them into ComEd’s TRC values, Guidehouse developed a methodology for monetizing societal health NEIs using two tools developed and maintained by the US Environmental Protection Agency (EPA): AVoided Emissions and geneRation Tool (AVERT) and CO-Benefits Risk Assessment (COBRA).

At a high level, AVERT calculates avoided emissions associated with energy efficiency programs based on generation across the EPA-defined Great Lakes/Mid-Atlantic eGRID region for ComEd. COBRA calculates the societal health impacts of chronic and acute bronchitis, non-fatal heart attacks, respiratory or cardiovascular hospital admissions, work loss days, and other impacts associated with improved outdoor ambient particulate matter.

To estimate societal health NEIs, Guidehouse implements the following four-step process:

Step 1: Guidehouse develops the portfolio-level cumulative annual savings values.  

Step 2: Guidehouse applies the AVERT model to determine county-level emissions reductions for each pollutant studied.

Step 3: Guidehouse uses the AVERT outputs to execute the COBRA model to estimate the health impacts of reduced pollution exposure over a 20-year period.

Step 4: To be consistent with other TRC testing inputs, Guidehouse discounts each year’s COBRA results to the analysis year using a 0.42% real discount rate.

Figure 1 below shows the process Guidehouse uses to quantify and monetize societal health NEIs. See Chapter 7.2 of the Methods, Tools, and Resources handbook for more information about measuring societal health impacts.

Figure 1. Guidehouse Methodology for Estimating Societal Health NEIs

ComEd Cost-effectiveness Test Results

To determine the impact of societal health NEIs on cost-effectiveness, Guidehouse produces annual TRC values with and without societal health NEIs for all of ComEd’s energy efficiency programs and pilots, as shown in Table 1.  

ProgramIllinois TRC Test (without Societal NEIs)Illinois TRC Test (with Societal NEIs)
Appliance Rebates2.353.16
Elementary Energy Education6.528.74
Residential HVAC4.005.55
Single-Family Assessment2.643.80
Residential Behavior6.5211.51
Lighting Discount5.277.99
Multi-Family Assessments1.372.08
Residential Total3.875.82
Agriculture2.724.16
Business Grocery6.597.71
Business Instant Discounts3.886.06
Business Telecomm1.732.98
Facility Assessments0.260.55
Incentive – Custom + Standard1.662.45
Industrial Systems + Industrial Energy Management1.382.42
LED Streetlighting2.143.57
Non-Profit Retrofits1.382.25
Non-residential New Construction2.073.20
Public Buildings in Distressed Communities1.181.65
RetroCommissioning + VCx4.367.98
Small Business3.254.19
Small Business Kits3.774.79
Strategic Energy Management2.475.12
Business Total2.453.56
Affordable Housing New Construction0.811.23
Food Bank-LED Distribution8.5413.02
Product Discounts – [Lighting Discounts + Appliance Rebates – IE]6.5410.13
Multi-Family Retrofits – IEMS + IHWAP0.841.07
Public Housing Retrofits0.610.93
Single Family Retrofits – CBA + IHWAP0.460.95
UIC-ERC Income Eligible Kits7.9911.14
Income Eligible Total4.226.28
Voltage Optimization2.573.99
Building Operator Certification2.664.60
Efficient Choice0.991.53
Electric Homes New Construction0.631.00
ENERGY STAR Retail Products Program0.100.17
SEM Water Savings13.8313.83
Upstream Commercial Food Service Equipment1.392.29
Pilot and VO Total2.373.66
Res and Business Total2.523.69
Portfolio Total (w/ IE, Pilot and VO)2.623.89
Table 1. CY2021 ComEd TRC Results with and without Societal Health NEIs

As can be seen from the table, ComEd’s portfolio-level TRC score increased by nearly 50% from 2.62 to 3.89 with the addition of societal health NEIs. Additionally, several programs saw their scores increase enough to push them past the 1.0 threshold that typically determines program cost-effectiveness, including Affordable Housing New Construction, Multi-Family Retrofits, Efficient Choice, and Electric Homes New Construction. Societal health NEIs increased the TRC scores for these programs by 25-50%, and while low-income programs are not required to meet the TRC test (per the Illinois Energy Efficiency Policy Manual 2.1), the non-income eligible programs may have been deemed not cost-effective absent accounting for the societal health NEIs.

Guidehouse’s methodology represents a relatively low-cost approach to reflect societal health benefits in BCA. To learn more about Guidehouse’s societal NEI research and methodology, read their ACEEE Summer Study paper and societal NEIs evaluation study.

For more information on state energy efficiency program cost-effectiveness testing practices, including which states include NEIs, please visit the Database of Screening Practices (DSP).